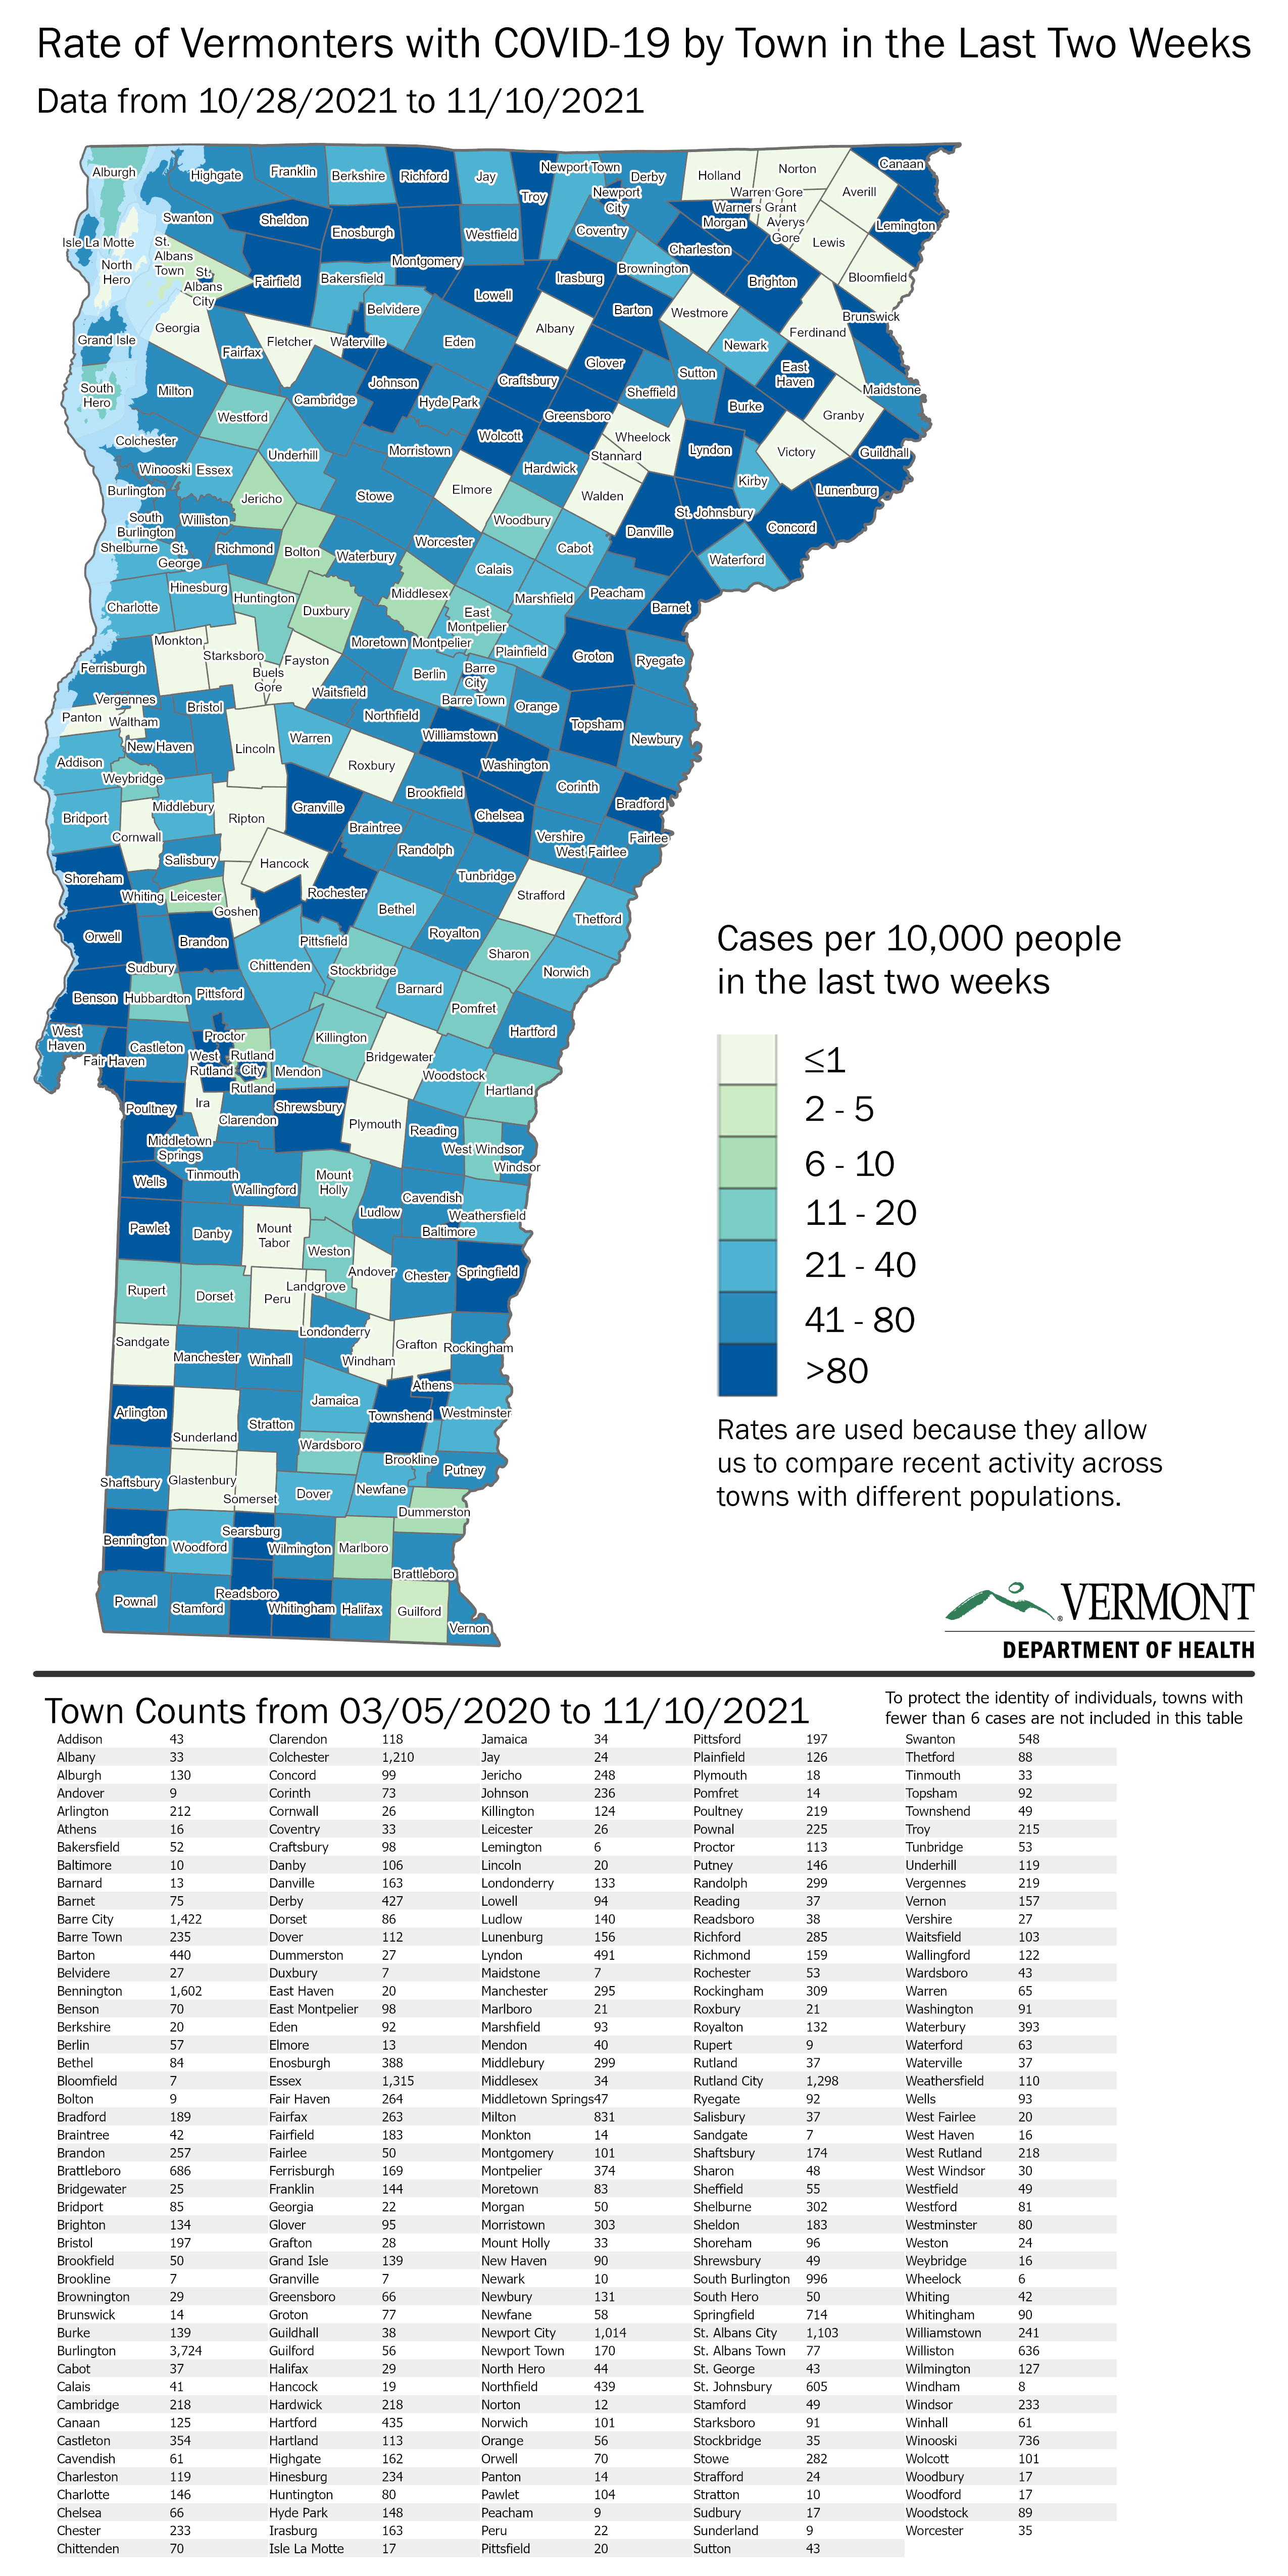
The Northeast Kingdom has been rocked by Covid cases in recent months as the Delta variant ripped through the region. Essex County is now reporting the highest Covid case rate of any county at any time during the pandemic.
But other communities have been hard-hit too, and the latest town-by-town data from the state Department of Health reveals how much a new spike in cases has affected southern Vermont in particular.
Rutland has just entered the highest category of case spread, department data shows, defined as more than 80 cases per 10,000 people in the past two weeks. Bennington and Springfield are also in the highest category.
Other communities in that category include St. Albans, St. Johnsbury and Barre. Barre has been reporting high case rates since September.
Meanwhile, the Vermont Department of Health on Saturday tweeted that “due to the large number of Covid-19 cases” across the state, it’s prioritizing contact tracing people “at higher risk.”
Vermonters who test positive for Covid were asked to “isolate at home away from other people and begin reaching out to close contacts immediately.”
Due to the large number of COVID-19 cases, we are asking Vermonters who test positive to isolate at home away from other people and begin reaching out to close contacts immediately.The Health Department will prioritize contact tracing to people at higher risk. (1 of 2)
— VT Dept of Health (@healthvermont) November 13, 2021
(2 of 2): If you test positive for COVID-19, you may not get a phone call from a contact tracer, but you still need to stay home and away from others, and follow steps on our website to stop further spread: https://t.co/PSqeMtZhCc
— VT Dept of Health (@healthvermont) November 13, 2021
The health department reported 463 new Covid cases on Saturday, bringing the seven-day average to an all-time high of 367.
A total of 44 people were hospitalized in Vermont, down from 52 on Friday. The share of hospitalized Covid patients in intensive care units remained at 13.
Use the table above to see how cases are faring in your community, or check out the department map to see geographic patterns in the data.
— Maggie Cassidy contributed reporting.