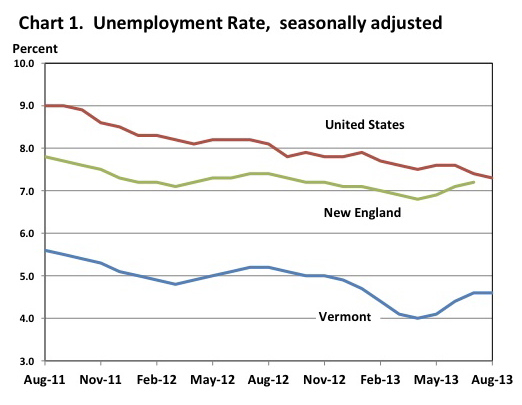
Vermont’s official unemployment rate held steady at 4.6 percent in August, while the national unemployment rate ticked down from 7.4 to 7.3 percent.
Top-five rankings nationwide remain nearly unchanged: North Dakota wins the prize with only 3 percent unemployed. Vermont and Wyoming share fifth place, but Vermont leads New England.
Compared to August 2012, when more than 18,000 Vermonters were considered unemployed, 4.6 percent represents a decline of 0.6 percent.
The latest monthly report from the state Department of Labor compares both seasonally adjusted and non-seasonally adjusted estimates of the civilian labor force, based on Bureau of Labor Statistics surveys. Overall, the report depicts minor (and not statistically significant) shifts since July: 100 more workers, with 50 fewer employed and 100 more unemployed.
Looking at non-seasonally adjusted data, every labor market in the state appears to have experienced improvements, and several of more than 1 percent since the same month a year ago. The statewide profile is bookended by the Hartford area, where all but about 2.8 percent of the market are considered employed, and Newport, where 5.2 percent of the labor force considered unemployed.
Labor commissioner Annie Noonan said in a news release that August may represent a “turning point” for the economy. She highlighted the importance of summer for the leisure and hospitality and construction industries.
Industry highlights
“The monthly increase seen in the August numbers was predominately attributable to seasonal increases in the Leisure and hospitality,” Noonan said. The estimated total labor force in the industry ranges between roughly 34,000 to 36,000 people.
Overall, arts, entertainment, recreation, accommodation and food services saw a 2.7 percent employment increase in the last year without seasonal adjustments. When those data are seasonally adjusted, the industry still shows yearly gains — but less than 1 percent. Statistical adjustments, however, which improve month-by-month comparisons, show a nearly 1 percent decline from July.
Construction, often considered a signal of more economic activity to come, is stronger across the board.
“This month’s data showing a rise in construction employment is a positive sign and hopefully the start of sustained employment growth in the industry,” Noonan said. But, she pointed out, construction jobs remain near recessionary lows. And economists have pointed out this summer that, as Tropical Storm Irene recovery winds down, the construction sector will rely on the private sector to get building again.
The construction labor force is estimated at less than half that of leisure and hospitality, fluctuating around 14,000 positions.
Without seasonal adjustments, August brought about 450 more people into the construction fold since July — a gain of 200 since the year before. Those are 2.9 percent and 1.3 percent increases in the employment base, respectively. Accounting for seasonality, those gains translate to about 500 people, or 3.7 percent, since July. It’s not enough to move the bar since 2012, however.
Other increases in seasonally adjusted jobs numbers include wholesale trade, up 2.1 percent since July and 6.5 percent since August 2012. Overall, professional and business services is up 4.2 percent from a year ago. Within that industry, however, professional, scientific and technicaljob numbers are down. The gain is due to a 15.7 percent increase in administrative positions.
Notable declines are transportation, warehousing and utilities, down 1.2 percent from 2012 despite an equal percentage gain since July.
Alternative measurements
“Official” unemployment numbers are based on one of six different measures. Known as U-3, the estimate — and it’s only an estimate, not a count — generally considers whether or not people are available to take a job or have looked for work in the last month.
Other measures consider how long unemployed people have been without work, the number of people who have lost jobs or worked temporary jobs, and variations on workers who are discouraged or underemployed.
Comparing long-term unemployed rates (U-1) nationwide, not much changes in the top-five rankings. North Dakota keeps the prize with just 1 percent, and Vermont ties for fifth place — but this time with Montana.
The broadest measure of unemployment (U-6) captures the total unemployed in the “official” rate, plus people who are no longer looking for work, as well as those working part-time who’d prefer to work more.
Here again, top-five rankings don’t change much — but percentages do. Sharing seventh place, Vermont is estimated to have 10.5 percent of its civilian work force either unemployed, underemployed or out of the job market.