As Covid cases rise, the Vermont Department of Health has resumed some data collections it had stopped or slowed down when case numbers plunged in June and July.
One of those is town-level data. The health department reported town data only once for the month of July, but has now restarted the publication of town data on a weekly basis, allowing for a more detailed comparison of which communities have been most affected in the latest surge of the coronavirus.
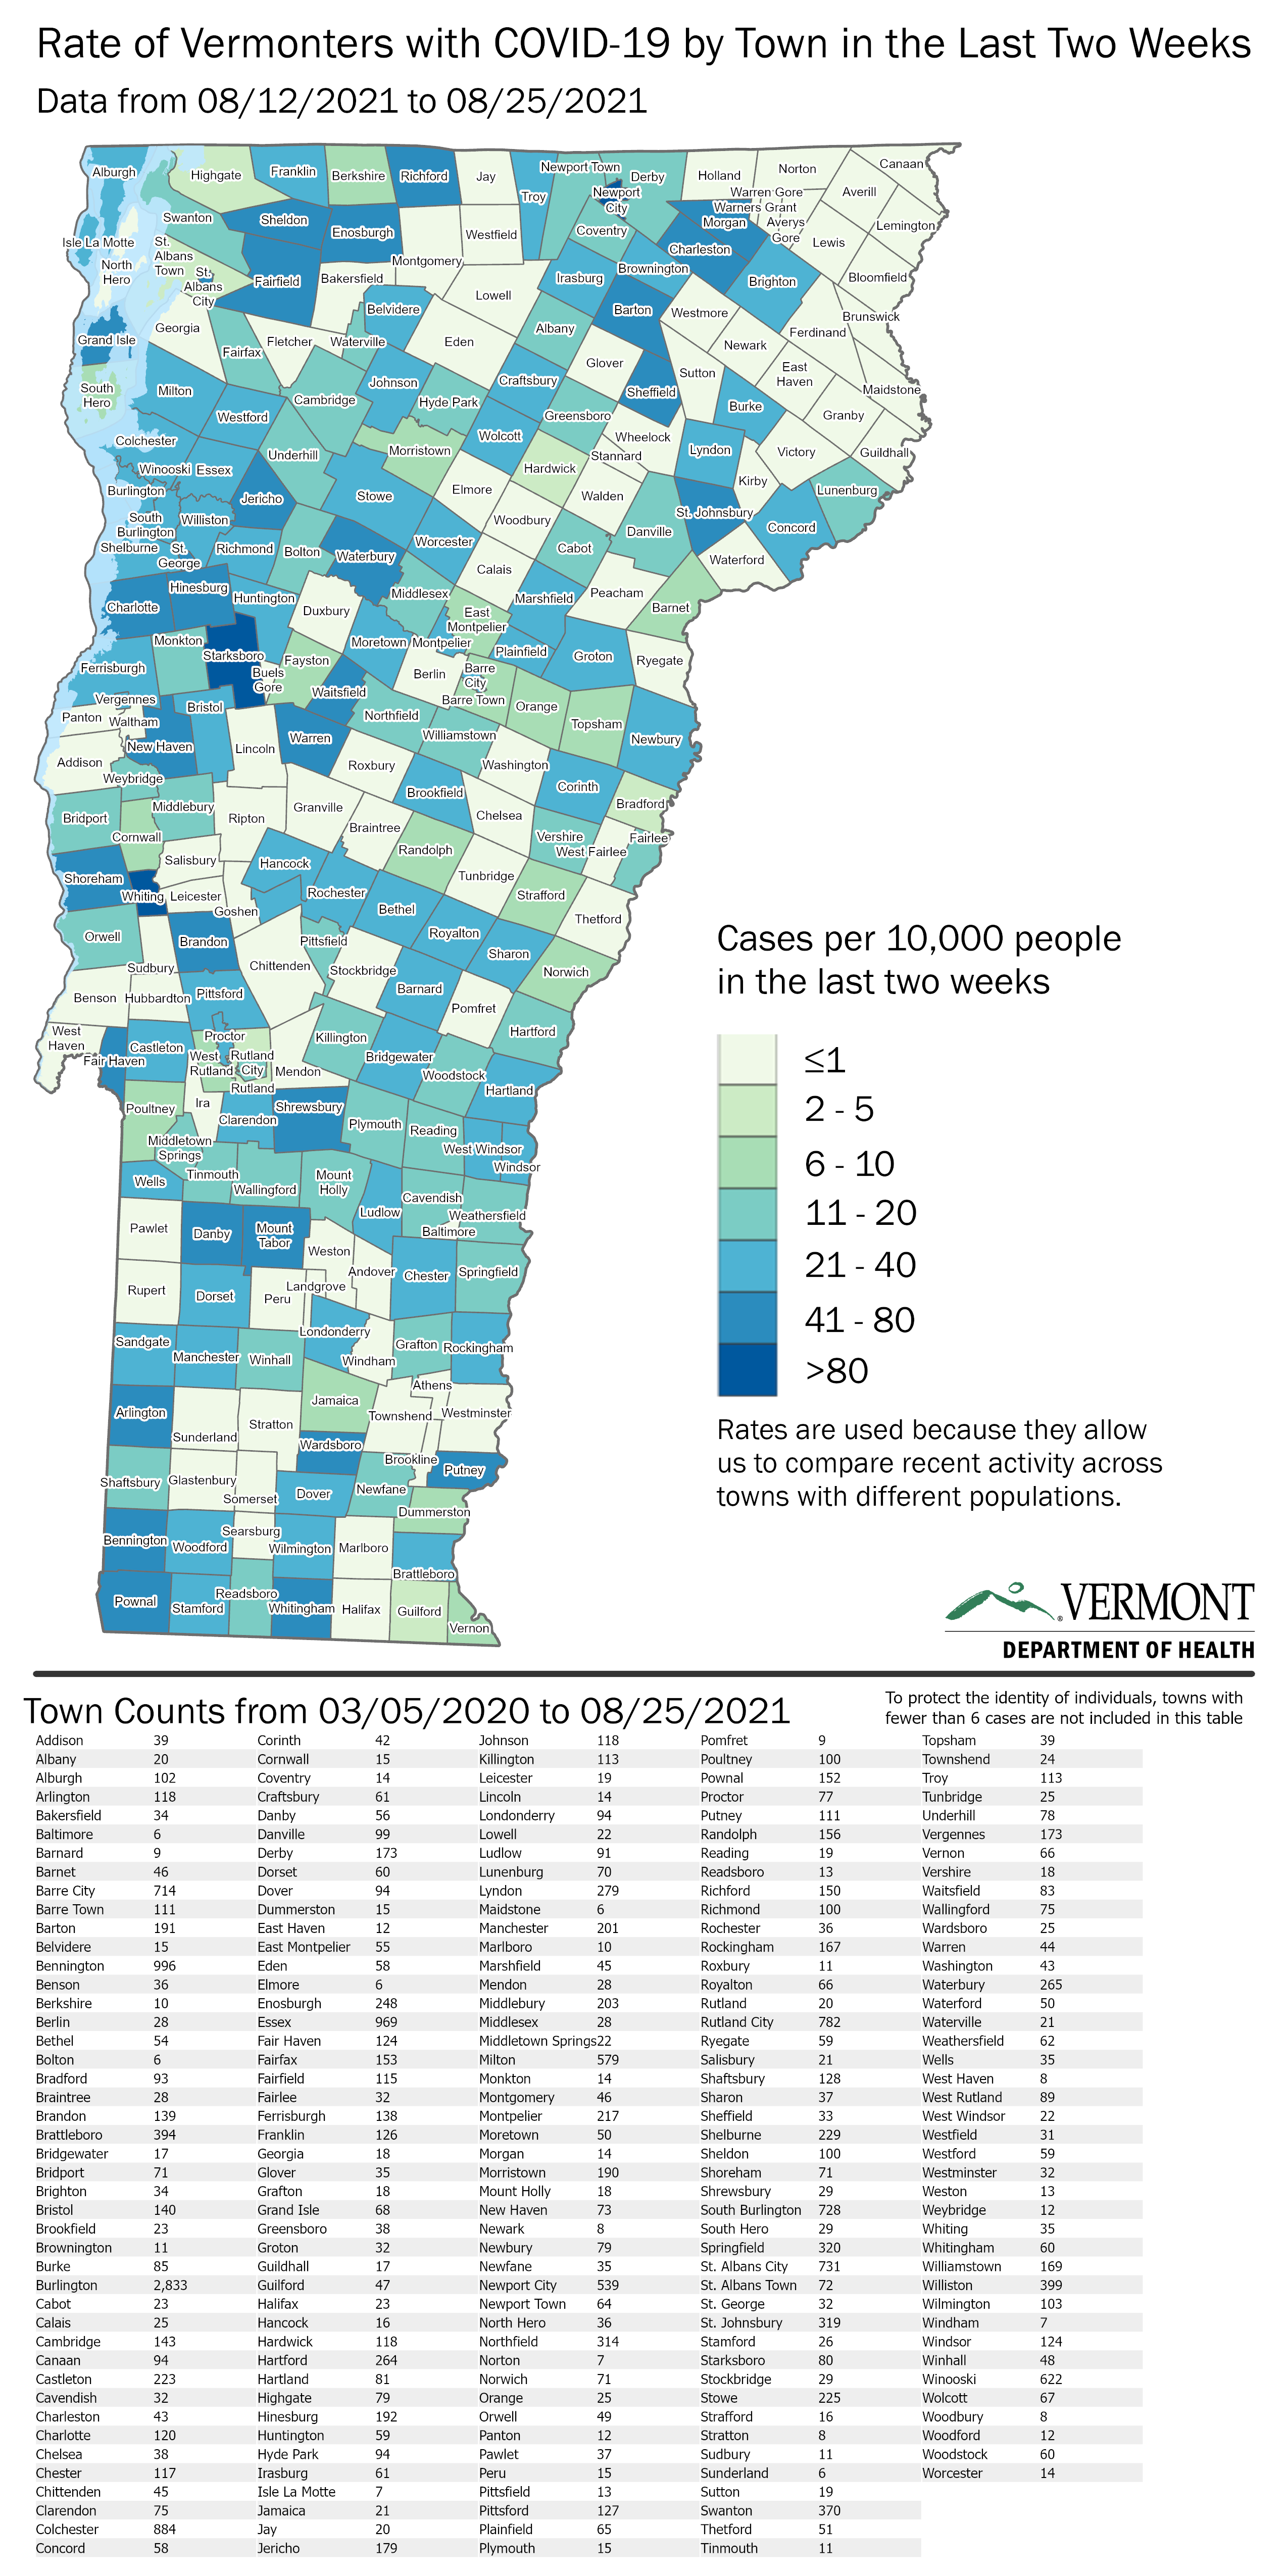
However, the town-by-town map also reveals the latest surge appears to be distributed throughout the state as opposed to being concentrated in one particular area, although Chittenden County has the most communities with elevated case rates during the past two weeks.
The communities reporting the highest category of case spread — more than 80 cases per 10,000 people in the past two weeks — were Whiting, Starksboro and Newport City, which reported 25 new cases during that time period.
Burlington reported 129 new cases in the past two weeks, the most of any community in the state, bringing its total to 2,833.
Check out the table above to see how cases have changed in your community in the past two weeks, or see the health department map for a better understanding of how cases compare to your community’s population.
Keep in mind that town-level data may be distorted by the quirks of address reporting in Vermont. For example, communities without a post office may have residents who test positive but list their mailing address as their town of residence.
The health department tries to correct for those issues by asking about an individual’s exact town of residence during contact tracing.