Editor’s note: This commentary is by Jay Eshelman, of Westminster, who is a business owner and a former Work Force Investment Board and River Valley Technical Center board member.
The generally accepted payroll statistics typically cited by economists are so-called nonfarm payrolls. They include all payrolls with the exception of farm work, unincorporated self-employment (sole proprietorships), employment by private households (lawn and gardening, housecleaning, and so forth), the military and intelligence agencies. In most states, nonfarm payrolls account for the significant majority of total payrolls. But in a state like Vermont, farm payrolls are a more significant proportion of the economy than they may be elsewhere and deserve careful consideration.
In 2007, for example, farm payrolls accounted for 10.23 percent of Vermont’s total employment.
For comparison:
• In 2007, farm payrolls accounted for 4.82 percent of Connecticut’s total employment.
• In 2017, farm payrolls declined to only 5.65 percent of Vermont’s total employment.
• In 2017, farm payrolls increased to 7.60 percent of Connecticut’s total employment.
Clearly, when comparing job growth in Vermont from year to year, it’s more important to consider farm payrolls in the calculation than it may be in Connecticut. After all, and as you can see, Vermont’s farm employment has declined significantly compared to Connecticut’s and has had a much greater effect on Vermont’s total employment circumstance.
On the other hand, in the interest of comparing apples to apples, reviewing all three employment statistics, total employment, nonfarm employment and farm employment, for each state provides the most comprehensive assessment.
But for this discussion, let’s consider only Vermont’s employment numbers.
When Auditor Doug Hoffer cites Vermont’s 22,000 job increase from 2009 to 2017, he’s using the generally accepted “data set” that accentuates Vermont’s job growth in its most positive light. First, he ‘s citing only nonfarm employment. Second, he’s chosen 2009 as the employment basis period, a time, coincidentally, that reflects the lowest Vermont employment numbers in more than a decade.
What follows is a spreadsheet showing Mr. Hoffer’s assessment period beginning in 2009, just after the recession hit Vermont, alongside the same assessment with an employment basis period of 2007, just two years earlier when Vermont’s economy was peaking.
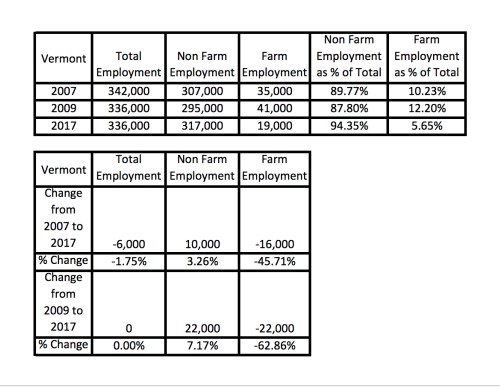
As you can see, and as Mr. Hoffer pointed out, between 2009 and 2017, Vermont added 22,000 nonfarm jobs. Unfortunately, they were offset entirely by the loss of farm jobs.
When using 2007 as the employment basis point, Vermont added only 10,000 nonfarm jobs and they were more than offset by the significant loss of 16,000 farm jobs, for a net total loss of 6,000 jobs for the period.
For you number crunchers out there, I’m using U.S. Labor Department data that can be found here.
And the numbers for dates preceding 2017 are estimated from the graphs provided. But my estimates appear to very closely match Mr. Hoffer’s citations, so they aren’t far from being precise.
Lastly, this U.S. Labor Department data is very nicely presented and allows comparisons between all of the states in all of the various labor categories.
For example, if we put Florida’s data in the same spreadsheet model, this is how its economic performance compares to Vermont’s. Note: 2010 is the time period most severely affected by the Florida recession that correlates with Vermont’s 2009 recession.

Well done, Florida. Now that’s a nifty economy.
I welcome alternative points of view and corrections where errors may exist. I have no intention to, and will not, run for political office. Nor do I have any political affiliations or political conflicts of interest. I offer this information because I believe all Vermonters should do their due diligence when considering their elected representatives.