

This is the first in a series on Vermont public school performance on the SBAC tests.
A data dig into test scores shows who did well, who didn’t
The Smarter Balanced Assessment Consortium standardized test was given to nearly 6 million students last spring.
In September, the Agency of Education released results that included 41,000 Vermont elementary, middle and high school students.
VTDigger has analyzed Vermont’s Smarter Balanced testing data, known as the SBAC, by grade, by school and by county. The Vermont Agency of Education does not rank schools by student performance, nor do the other 14 states that use the SBACs. This is not a national test, so there isn’t a national achievement level for comparing Vermont student performance.
The statewide average SBAC score dropped by 20 points in 2017 as compared with 2016 test results.
The average percentage of students achieving proficiency this year was 48.4 percent, down from 50.92 percent last year.
In almost every grade tested, in both English and math, the percentage of students scoring proficient or above was also lower than in 2016.
Proficiency is a less precise measurement of a school’s achievement, since two schools can have the same percentage of students scoring proficient yet have different average scale scores.
In almost every grade tested, in English and math, the percentage of students scoring proficient or above was lower than in 2016. Low-income students on average couldn’t reach the state average score in either subject in any grade. And while the gap between low-income and wealthier peers is closing, the shift is due to better-off peers losing ground.
The SBACs measure students’ performance against the Common Core standards in English language arts, or ELA, and math in grades three through eight and 11. The standards are expectations of what a student should know and be able to do at each grade level. Students who reach a certain score are deemed proficient. For 11th-graders, that means they are ready for college-level work.
The test scores are an indication of college readiness. In mathematics, for example, only five high schools have prepared a majority of their students to take college-level courses.
They are Stowe (71 percent of students prepared), Mount Mansfield Union in Jericho (62 percent), Middlebury Union (56 percent), Colchester (54 percent) and South Burlington (52 percent). Last year, only seven high schools prepared a majority of 11th-graders for college.
High-schoolers fared better in English, with the majority of secondary schools — more than 60 — preparing most of their students for college-level work. But in 25 high schools, only some students performed at a level showing they were prepared for college-level work.
The Agency of Education does not compare schools based on test scores because officials say there are too many variables that can change the outcomes. Vermont has a number of schools with too few students to even report scores. When student populations are small, one or two bright kids can sway the results for the grade and the school. That works both ways; when some students are struggling or dealing with outside problems, such as poverty and addiction within the family, the average can drop.
Student populations in 51 schools are too small to report SBAC results in the “all students” category without the possibility of identifying individual students, according to the Education Agency. VTDigger’s analysis does not include those schools, which have 11 or fewer students in a grade. That number is up from 47 schools that were too small to report last year, another sign of Vermont’s shrinking student rolls.
Michael Hock, assessment director at the agency, said that although test scores help parents figure out how a school is performing, the scores should be used with caution. “Keep in mind that judging a school with only this one tool is likely to lead to erroneous and unjust conclusions,” he said.
VTDigger’s graphs and charts are designed to help readers see how students and schools performed. Schools are ranked based on average scale scores (see the sidebar for an explanation of scoring). Schools that had the highest scale scores are considered the highest-performing because they had the most students achieving that score.
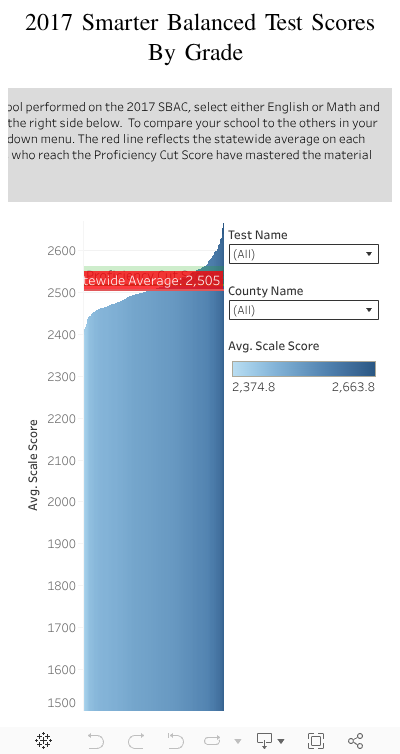
The first data visualization shows how all students performed in each public school at each grade level. It also allows a comparison of student performance in each school and county in each grade and subject. Other graphics show that across the state, students on average did not perform as well in 2017 as they did the previous year.
Interactive Graphic: Compare your school
It used to be students showed up on test day with a sharpened No. 2 pencil and filled in bubbles on a paper form, but now they sit at a computer to take their test. The Smarter Balanced test uses pattern scoring, which means a student’s score reflects not just the number of questions answered correctly but also the level of difficulty. The test’s algorithm uses the information to assign the student’s performance a number, called a scale score or scaled score, on a range from 2000 to 3000.
Students’ SBAC scores are graded on a scale of 1 to 4. Students scoring at achievement level 1 are not meeting expectations. Students who have mastered the material for their grade score at level 3, which means they are proficient, and if they score at level 4 they are advanced. That is why we report results as proficient and above.
To try to even out results and make tests comparable over time and among schools, test companies use a process called “equating” to figure out how many points are needed for each performance level.

Where are the top-scoring schools?
The highest-performing schools on the 2017 SBACs include Charlotte Central, Fayston Elementary, White River School in Hartford, Marion Cross School in Norwich, Monkton Central, Burke Town School, The Newton School in Strafford, Barstow Memorial School in Chittenden and Stowe High School.
Last year, Marion Cross, Barstow, White River and The Newton School also had students scoring the best in the state. At Marion Cross, White River and The Newton School, students are topping the state in the same grades as last year, indicating it may be due to strong teachers. But at Barstow Memorial, last year’s seventh-graders were best in English and this year’s eighth-graders took top honors, indicating perhaps the strength of that class of students.
School test results are affected by school size and location and the economic status of the community.
“These factors have a great impact on test scores,” said Hock. “For example, test scores in a school with a large population of students who speak English as a second language could represent a higher level of effort and greater success than a school that has few or no English language learners,” he said.
The schools that performed poorly in one or more grades or subjects include Coventry Village School, Cabot School, Troy School, Rochester School, John F. Kennedy Elementary in Winooski, Winooski Middle and High School, Orange Center School and Blue Mountain Union School in Wells River.
Last year, many of the same schools’ students performed poorly, including John F. Kennedy Elementary and Winooski Middle School. Those two have a number of students who are low-income or for whom English isn’t their native language, but they also scored low in fifth- and sixth-grade math both years.
Small school size and large low-income populations may have something to do with the performance at the other schools at the bottom of the list for two years, which include elementary grades at Cabot, Rochester and Troy. According to Hock, any problems are very visible at small schools, but in larger places students struggling with school or outside problems have very little impact on the average score.
Chittenden, Orange, Washington and Windsor counties were home to some of the highest-performing and lowest-performing schools.
Schools that performed best in the state in more than one grade and subject were from Chittenden and Windsor counties.
Third-graders at Charlotte Central bested the state in both subjects. Students there had an average score of 2505.9 (on a scale of 2000 to 3000), and 84 percent were proficient in English language arts. In math, third grade had an average score of 2525.5 (when the state average was 2438), and 88 percent scored proficient or above.
Charlotte’s eighth-graders had an average score in math of 2665.7, and 83 percent scored proficient or better. But Dummerston gets an honorable mention because its eighth-graders scored just under Charlotte’s, with an average of 2664.6, but it had more students scoring proficient and above: 87 percent.
In fifth and sixth grades, Marion Cross students dominated the state in both subjects, with 89 percent of fifth-graders and 96 percent of sixth-graders scoring proficient on the English test. The state average score in fifth-grade English was 2508, and Marion Cross students’ average score was 2592. In sixth grade, Marion Cross students averaged 2623, well above the state average of 2531.
In math, Marion Cross fifth-graders tied Monkton Central for the highest proficiency rate, at 79 percent. But Monkton beat Marion Cross on the scale score by 5 points, with an average of 2585. Marion Cross sixth-graders made up for it with 92 percent scoring proficient in math, the highest in Vermont, and a score of 2636, against a state average of 2519.
Many of the kids attending these schools are starting from a place of advantage. Chittenden County is the richest in the state, and Charlotte is the wealthiest town in that county. The median household income in Charlotte was $121,789 in 2015, according to the U.S. Census Bureau. Norwich, home to Marion Cross, is the wealthiest town in Vermont, with a median household income of $125,789.
Winooski schools performed poorly in grades five, six and eight in both subjects and in high school math, with only 4 percent of students testing proficient. But Winooski, also in Chittenden County, has more students who are not native English speakers and many who are considered low-income. The median household income is $49,612, far below the statewide average of $75,595 and lower than any of the other counties with schools scoring on that end of the spectrum.
Stowe High School, which was ranked the top performing public high school in the state by U.S. News in 2015. Photo by Jess Wisloski
Does money matter?
Lower-income students, as a group, tend to score lower on standardized tests. Among Vermont’s highest-performing schools, six out of nine had fewer low-income students than the state average of 39 percent. Marion Cross (7 percent) and Charlotte Central (13 percent) had the fewest poor students.
White River School and Burke Town had the most low-income students, with 48 percent of their students qualifying for free or reduced-price lunches, an indicator for poverty. On average the top schools had 26 percent of their students on that program.
Of the schools that didn’t do well on the assessments, all had significantly more low-income students than the state average. Coventry Village School had the most, at 71 percent, and John F. Kennedy Elementary had the fewest, at 47 percent. The average percentage of students on free or reduced-price lunch among low-scoring schools was 56 percent.
Even though almost half of White River School’s 190 students are low-income, and 26 percent are special education students — a larger percentage than any of the low-performing schools — the fourth-graders topped the state in math with 83 percent reaching proficiency.
For the most part, teachers at the high-performing schools were paid more than those at the lowest-performing schools. The top schools also spent more than the state average on their students, except at Barstow Memorial and Stowe High School. The state average teacher salary is $59,154, and the average spending per equalized pupil last year was $14,652.
Teachers at Marion Cross School had the highest average salary — $76,880 — and the per-equalized-pupil spending was highest among the best-performing schools, at $17,746. Charlotte was right behind, paying teachers on average $75,737 and spending $16,014 per student.
The schools that didn’t do well on the SBACs paid their teachers between $47,600 and $59,000 and spent between $12,900 (Troy School) and $16,800 (Cabot) per equalized pupil.
Charlotte, Marion Cross and Stowe High School — all schools where students performed tops in the state in multiple grades or subjects or both — had student bodies of 300 or more. Both elementary schools have student-to-teacher ratios of 15-to-1, while Stowe has 12 students to every 1 teacher. Monkton Central, whose fifth-grade students bested Marion Cross in math, has a student-to-teacher ratio of 17-to-1.
On average the highest-performing schools paid teachers $62,590 and spent $15,380 per equalized pupil. The lowest-scoring schools paid teachers around $54,800 and spent nearly $12,800 per equalized pupil.
Schools with the best math scores paid teachers around $58,600 last year.
Schools with the best scores for English language learners paid teachers $66,400 on average.
Interactive graphics: Scores by grade and by school


