

Editor’s note: This commentary is by Willem Post, a retired engineer, who now writes about energy issues, currently specializing in energy efficiency of buildings and building systems. He is a founding member of the Coalition for Energy Solutions.
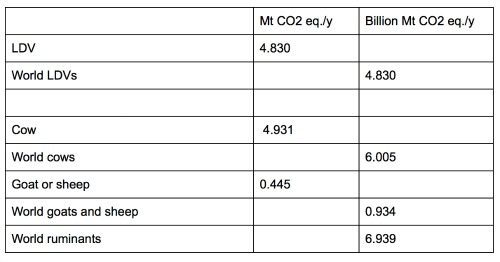
[I]n this article it is shown, the direct emissions of methane and CO2 of the world’s 3.6 billion ruminants is 6.939 billion metric tons of CO2 equivalent per year, and of the world’s 1.0 billion light duty vehicles is 4.830 billion metric ton CO2 equivalent per year; ruminant emissions are about 43.7 percent greater than light duty vehicles (car, SUV, minivan, ¼-ton pickup).
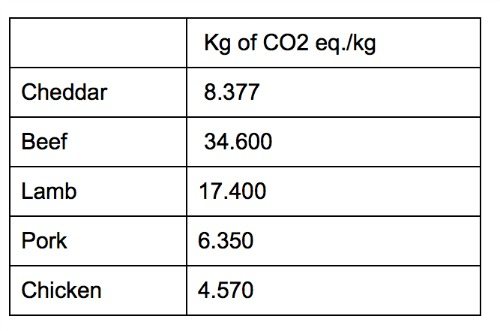
Additional ruminant related emissions are due to pasturing, feeding, processing, packaging, selling, etc. of meat and dairy products. For example, in the U.S., the life cycle CO2 equivalent emission for some products are as shown below:
http://www.timeforchange.org/are-cows-cause-of-global-warming-meat-methane-CO2
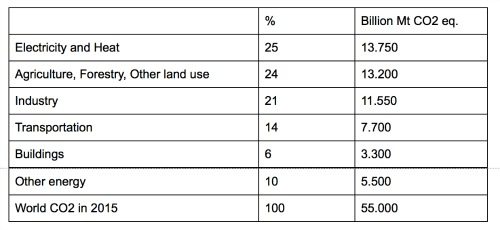
World CO2 Equivalent Emissions: The EPA and IPCC determined the emissions of agriculture, forestry and other land use were 13.200 billion metric tons of CO2 equivalent in 2015, or about 24 percent of the world’s man-made CO2 equivalent emissions. See below table.
https://www.epa.gov/ghgemissions/global-greenhouse-gas-emissions-data
http://www.ecofys.com/files/files/asn-ecofys-2013-world-ghg-emissions-flow-chart-2010.pdf
http://oceanacidification.msi.ucsb.edu/resources/imagegallery/data/GHG emissions.png/view
World Population: The above comparison of light duty vehicles to ruminant emissions is a consequence of the world’s population being in out-of-control growth mode for at least 200 years. That growth and the abundant availability of fossil fuels since 1800, have greatly increased electricity and heat generation, agriculture, industry, transportation, etc., which in turn increased the world’s CO2 equivalent emissions.
Since 1800, CO2 and methane emissions have increased from:
– The human population. See below table.
– Domestic animals; cows, sheep, goats, pigs, chickens, pets, etc.
– Rats, cockroaches, potato blight funguses, etc., which depend for their existence on our (unintended) generosity.
There is no solution to this trend, except to very significantly reduce the world’s population and have the remaining people reduce their energy consumption per capita by at least four times (the level of 1800) and consumption of other resources by at least 15 times (the level of 1800). This should not significantly affect living standards, because, at present, energy and other resources are used much more efficiently than in 1800.
Those measures would enable maintaining at least 50 percent of the world in pristine condition, so the world’s fauna and flora could re-establish itself to a semblance of its former glory. The present, locust-type devouring of the world by humans, their animals and other support systems, is a major aberration, and clearly should not continue. See below table.
https://en.wikipedia.org/wiki/World_population
Population chart
 World Wild Area Destruction: Here is a recent article regarding the destruction of the world’s wild areas. (Click on the dark blue in the first paragraph to obtain the full text.)
“By 2009, about 23% of Earth’s land remained as wilderness—about 30.1 million square kilometers spread mostly across North America, North Asia, North Africa, and Australia, they conclude today in Current Biology. That’s 3.3 million square kilometers less than in 1993, an area about twice the size of Alaska—Watson says.
South America has lost almost 30% of its wilderness in that time and Africa has lost 14%. The losses included the total devastation of several large swaths of forest and swamp in the Congo and in New Guinea.”
Very significant population reduction, much less consumption, and setting aside at least 50 percent of the world as pristine areas is required to preserve and protect the remaining fauna and flora. That should have a much greater priority than renewable energy systems, such as wind turbine and solar panel build-outs, etc. By the time all those renewable energy systems would be built, the world’s wild areas would be gone, and there would be 10 billion people.
Analysis of CO2 Emissions of Light Duty Vehicles and Ruminants*: Below are the details of comparing the emissions of the world’s light duty vehicles and the world’s ruminants due to breathing (CO2), belching (CO2 and CH4).
(*The emissions of farting, a small percentage of CO2 and CH4 emissions, and of feces, which produce CO2 and CH4, due to decomposition, and of urine, which produces CH3, are excluded. A very small percentage of the world’s ruminant feces are collected and treated by anaerobic digester systems to produce CH4 for heat and electricity generation; the CO2 is vented to the atmosphere.)
Light Duty Vehicles Emissions: One light duty vehicles emits about 10,647 pounds, or about 4.830 metric tons, of CO2 per year, based on CO2 emission per gallon = 19.4 pounds, combustion + 5 pounds upstream = 24.4 pounds; travel = 12,000 miles per year, assumption; MPG = 27.5, assumption. The world has about 1 billion light duty vehicles.
World light duty vehicles emission is about 1.0 billion x 4.830 = 4.830 billion metric tons of CO2 per year.
Ruminant CO2 and Methane (CH4) Emissions: The world has about 1.5 billion cattle (dairy and beef cows, buffalo, etc.), 2.1 billion sheep and goats, 1.0 billion pigs, and 21 billion chickens.
One dairy cow emits about 6,000 liters CO2 per day and 600 liters CH4 per day, about two times a beef cow, about 14 times a sheep, about 22 times a goat, about 74 times a pig. Assumption for calculations:
– 3,000 liter CO2 per cow per day, 300 liter CH4 per cow per day
– 333 liter CO2 per sheep or goat per day, 33 liter CH4 per sheep or goat per day
http://www.journalofdairyscience.org/article/S0022-0302(95)76907-7/pdf
https://muchadoaboutclimate.wordpress.com/2014/10/01/how-much-methane-does-a-cow-actually-produce/
One cow emits about 2.150 metric tons of CO2 per year, based on 3,000 liter CO2 per day, and 1.9631 g CO2 per liter.
One cow emits about 2.781 metric tons of CO2 equivalent per year, based on 300 equivalent
World cow emission is about 1.5 billion x (2.150 + 2.781) = 6.005 billion metric tons CO2 equivalent per year
One goat or sheep emits about 0.239 metric tons of CO2 per year, based on 333 liter CO2 per day, and 1.9631 g CO2 per liter.
One goat or sheep emits about 0.206 metric tons of CO2 equivalent per year, based on 33 liter CH4 per day; 1 cubic meter CH4 = 0.01693 metric tons CO2 equivalent
World goat and sheep emission is about 2.1 billion x (0.239 + 0.206) = 0.934 billion metric tons CO2 equivalent per year
World ruminant emission is about 6.005 + 0.934 = 6.939 billion metric tons of CO2 equivalent per year, or about 6.939/13.200 = 52.6 percent of agriculture, forestry and other land use CO2 equivalent emissions.
Additional ruminant-related emissions are due to pasturing, feeding, processing, packaging, selling, etc. of meat and dairy products. For example, in the U.S., the life cycle CO2 equivalent emission is about 8.377 kilograms per one kilogram of cheddar cheese, equivalent to travelling 9.44 miles at 27.5 miles per gallon.
http://clean-water.uwex.edu/pubs/pdf/CF-Cheese.pdf
However, the mileage comparison is a fallacy, because the “wheel-to-wheel” efficiency of internal combustion engine vehicles is about 16.0 percent, and of electric vehicles about 69.9 percent. The “well-to-wheel” efficiency of internal combustion engine vehicles is about 14.3 percent, and of electric vehicles about 29.2 percent
The above efficiencies are only for consumed energy, not embedded energy.
https://matter2energy.wordpress.com/2013/02/22/wells-to-wheels-electric-car-efficiency/
NOTE: The world’s 1.5 billion cows and 2.1 billion sheep, goats, etc., emit various gases, including methane, CH4, a greenhouse gas about 25 times more potent than CO2. Two-thirds of all ammonia, NH3, is emitted by cows. World ruminants eat about 50 percent of world’s food crops. See COWSPIRACY movie on Netflix.
NOTE: Some experts say 100-200 liters of methane per cow per day (or about 26-53 gallons), others say it’s up to 500 liters (about 132 gallons) per cow per day.
http://animals.howstuffworks.com/mammals/methane-cow.htm
NOTE: 1 cubic meter CH4 x (35.31466 cf CH4 / 1 cubic meter CH4) x (1 lb-mole / 379.48 cf) x (16.0426 lb. CH4 / 1 lb-mole) x (1 metric ton / 2,204.62 lb.) x (25 CO2 equivalent / 1 CH4) = 0.01693 metric ton CO2 equivalent
http://animals.howstuffworks.com/mammals/methane-cow.htm
https://www3.epa.gov/gasstar/tools/calculations.html
The proposed 28 turbine, 96.6 MW, $250 million, Windham/Grafton wind turbine power plant in Vermont would produce about 280,000 MWh per year, which would reduce CO2 emissions by about 92,104 metric tons per year, based on 0.3296 metric tons of CO2/MWh on the New England grid. The CO2 reduction is:
– Equivalent to the exhaust of about 92,104/4.830 = 19,069 light duty vehicles.
– Equivalent to the emission of about 92,104/4.931 = 18,679 cows.


